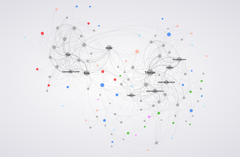
Visualized data of trigon as a network by Branka Benčić and Tihana Puc; programmed by Mihael Giba
Propositions for a Map of trigon
1. trigon network
trigon network displays the connections between 758 artists and artist collectives that exhibited in trigon between 1963 and 1995. It contains two types of nodes – artists and exhibitions. The nodes in the map are sized proportionally to their 'degree centrality' – the number of ties that each node has, i.e. the number of artists participating in each exhibition.
To access the interactive map please click here.
2. trigon 67 – network fragment
The network displays the connections between six artists that exhibited at trigon 67 (Marc Adrian, Gianni Colombo, Luciano Fabro, Oswald Oberhuber, Ivan Picelj, and Vjenceslav Richter) and art institutions where they're work was exhibited from 1960 to 1979. The map contains two types of nodes – artists and exhibition spaces linked via exhibitions. It is based on 754 exhibitions in 440 art institutions in 44 countries. The nodes in the map are sized proportionally to their 'degree centrality' – the number of ties that each node has, i.e. the number of exhibitions each artist has participated in, as documented in artists’ CVs.
To access the interactive map please click here.
3. trigon 67 – network fragment
The network shows the relations between the selected six trigon 67 artists and art institutions where they exhibited during the 1960s and 1970s, though not necessarily at the same time. Thus, the map does not display only the connections between the artists and art institutions established through the same exhibitions, but reflects on the shared art institutional space during the given period of time. The map is based on 343 exhibitions in 81 exhibition spaces in 20 countries.
To access the interactive map please click here.
4. trigon 67 – network fragment
The network shows the relations between the selected six trigon 67 artists and art institutions where they exhibited together during the 1960s and 1970s. For the same set of artists as in the previous map, the exhibitions they participated in together are extracted. The map is based on 71 exhibitions in 57 exhibition spaces in 17 countries.
To access the interactive map please click here.
5. trigon 67 – network fragment
The network is the same as the previous one (figure 4) displaying the names of the exhibitions in which the artists have participated.
To access the interactive map please click here.
6. trigon as network
“Proposition for a Map” of trigon is an overview of the fragmentary map of exhibitions, artists, and artistic occurrences in the Trigon region in the 1960s and 1970s, focusing on similar ideas, concepts, common themes, and contexts. It provides a fragmentary insight into the exhibitions like “New Tendencies” (Zagreb), “trigon” (Graz), “Motovun Encounters” (Motovun, Istria), “April Meetings” (Belgrade), meetings at Brdo (Brdo, Istria), which can be identified as the points of exchange between artists from Yugoslavia, Austria, and Italy. The perspective on “trigon” and related events therefore combines a critical geography of art connecting artists, institutional and social relations as cultural subjects. “trigon” is seen as a transnational trajectory of the institutional mechanisms of art.
A look back at “trigon” may help to establish the contextual framework, taking into consideration a series of social and cultural conditions in the geopolitical region it occupies. It examines positions and transformations within the wider social, cultural and institutional sphere – in the confrontation between the viewpoints of history and art history, cultural, political frameworks and institutional critique. Thus, a contribution to research of Trigon may serve as point to explore and connect histories of trigon along with similar events in the wider cultural context of the trigon region, along with the cultural space of former Yugoslavia.
To access the interactive map please click here.
Figures 1-5
Data on the exhibitions was analysed by Gephi 0.9.2: An Open Source Software for Exploring and Manipulating Networks
Authors: text, concept and data: Tihana Puc, visualisation: Mihael Giba
Figure 6
Data on the exhibitions was analysed by Gephi 0.9.2: An Open Source Software for Exploring and Manipulating Networks
Authors: text, concept and data: Branka Benčić, visualisation: Mihael Giba
Recommended browser: Firefox or Chrome


, Lisa Schoger (rechts)")